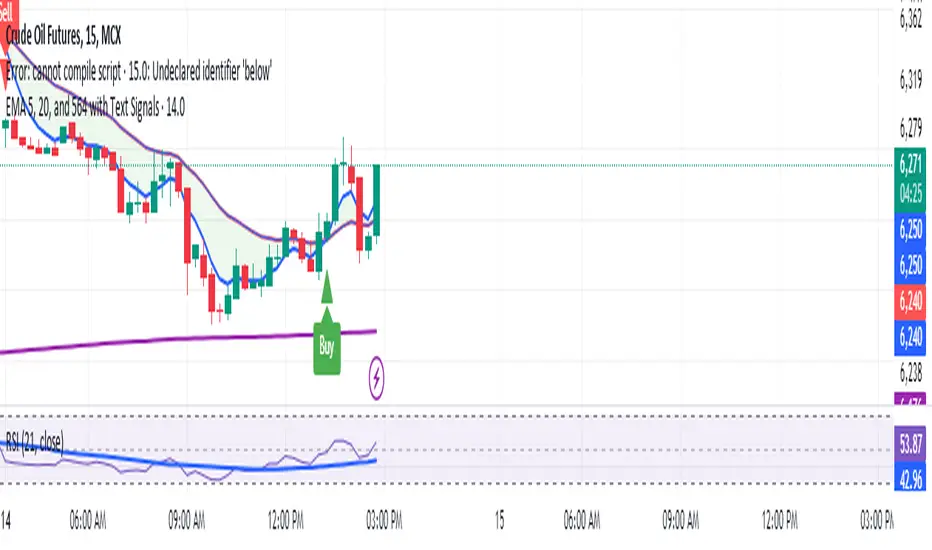
Manoj Personal EMA 5-203 EMA Trading Strategy Script Overview:
EMAs Used:
5 EMA: Short-term moving average.
20 EMA: Medium-term moving average.
564 EMA: Long-term moving average to identify overall trend direction.
Entry Signals:
Strong Buy: Triggered when:
Price is above the 564 EMA (uptrend).
The 5 EMA crosses above the 20 EMA (bullish crossover).
The current candle is green (close > open).
Strong Sell: Triggered when:
Price is below the 564 EMA (downtrend).
The 5 EMA crosses below the 20 EMA (bearish crossover).
The current candle is red (close < open).
Exit Signal:
Position is closed when the price touches back to the 564 EMA (either side, up or down):
A "Close Position" label is shown in green for long trades.
A "Close Position" label is shown in red for short trades.
Risk Management:
Stop-Loss: Placed at the last swing low (for longs) or last swing high (for shorts), calculated over the last 10 bars.
Take-Profit: A 1:3 risk/reward ratio is used, where the potential reward is three times the risk.
Alerts:
Alerts are triggered for buy and sell signals.
Alerts are also triggered when the exit condition (price touching the 564 EMA) is met.
This script is designed to work on timeframes of 15 minutes or higher but can also be used for 5-minute scalping. It plots the EMAs on the chart, highlights buy/sell opportunities, shows stop-loss and take-profit levels, and generates alerts for key signals.
Cerca negli script per "Buy sell"
V20 with Prices- Ashish SinghV20 with Prices
The V20 with Prices strategy is a unique tool designed to assist traders in identifying potential buy and sell levels by analyzing continuous bullish price movements (green candles). This strategy tracks streaks of green candles and calculates key price levels based on the highest and lowest points during the streak. It highlights potential reversal points, giving traders insights into where they could consider buying or selling based on price movement thresholds.
Key Features:
Tracking Green Candle Streaks: The V20 with Prices strategy identifies sequences of continuous green candles and captures the lowest price and highest price within the streak, helping traders identify potential turning points in an uptrend.
Next Buy and Sell Levels: After a streak of green candles ends, the strategy highlights:
Next Buy at: The lowest price of the streak, indicating a potential re-entry point if the price revisits this level.
Next Sell at: The highest price of the streak, indicating a potential profit-taking point if the price reaches this level again.
Both of these price levels are displayed on the chart, and traders can choose whether to show these levels via customizable input settings.
Movement Percentage Highlight: The strategy calculates the percentage movement between the lowest and highest prices in the streak. If the movement exceeds the user-defined threshold (default is 20%), it highlights these candles with a green background, allowing traders to quickly identify significant price movements.
Customizable Price Display: Users can toggle the display of the Next Buy at and Next Sell at price levels through input settings, providing full control over what is shown on the chart.
How It Works:
Green Candle Tracking: The strategy identifies a streak of green candles where the close price is higher than the open price. During this streak, the lowest low and highest high are tracked.
Price Movement Threshold: If the movement between the lowest low and highest high exceeds the user-defined threshold, the candles are highlighted with a green background.
Key Levels: After a streak of green candles ends (when a red candle appears), the Next Buy at and Next Sell at levels are stored and displayed, giving traders clear reference points for future price action.
How to Use:
Movement Threshold: Customize the movement threshold to filter significant price moves. A higher threshold reduces sensitivity to small movements, while a lower threshold increases sensitivity.
Customizable Price Display: Toggle the display of key price levels to match your trading style.
Ideal Use Cases:
Trend-following: The strategy is perfect for traders looking to identify potential re-entry points during an uptrend or take-profit points as the price reaches new highs.
Retracement Trading: Traders can monitor the Next Buy at level to capitalize on price retracements after strong upward movements.
Important Notes:
Disclaimer: This strategy is for informational purposes only and is not intended as financial advice or a buy/sell recommendation. Traders should always perform their own analysis before making any trading decisions.
Non-Repainting: This strategy does not repaint, ensuring that all displayed levels are based on actual price action.
Open Source: The logic and source code are transparent, allowing traders to modify the strategy if needed.

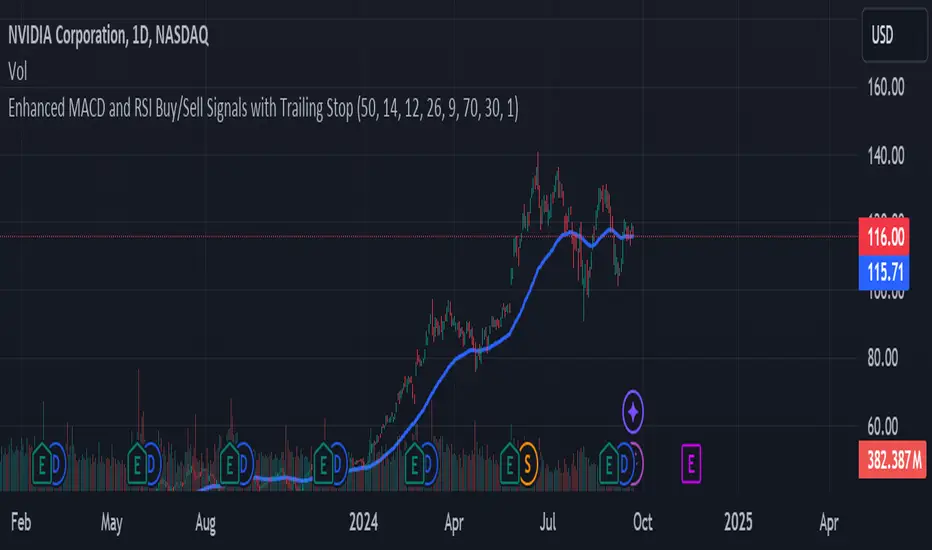
Enhanced MACD and RSI Buy/Sell Signals - Created by Marco NucupKey Features:
EMA Filter: Adds an Exponential Moving Average (EMA) to filter signals based on the trend. Buys are only considered when the price is above the EMA, and sells when below it.
Customizable Inputs: Users can adjust parameters for EMA, MACD, and RSI directly from the TradingView interface, allowing for more personalized strategies.
Alerts: The script includes alert conditions for both buy and sell signals, enabling users to receive notifications.
Signal Plotting: Visual indicators for buy and sell signals on the chart, along with the EMA line for trend reference.
Relative Rating Index (RRI)The technical rating is one of the most perfect indicators. The reason is that this indicator is based on a majority vote of multiple indicators. It is logical that the judgment based on a majority vote of multiple indicators would not be inferior to the judgment made using only a single indicator. However, just as any indicator has its shortcomings, the technical rating also has weaknesses. The most significant issue is that it primarily provides only a momentary evaluation of the current situation.
Let's consider this in more detail. In the technical rating, an evaluation of 1.0 by the majority vote of indicators is considered a strong buy. However, in the market, there are naturally varying levels of strength. For example, would a market that only once reached an evaluation of 1.0 within a given period be considered the same as a market that consistently maintains an evaluation of 1.0? The latter clearly shows a stronger trend, but the technical rating does not provide an objective criterion for such differentiation. While it is possible to check the histogram to see how long the buy or sell rating has continued, there is no objective standard for judgment.
The indicator I have created this time compensates for this weakness by using the concept of RSI. As is well known, RSI is an indicator that shows the momentum of the market. RSI typically calculates the strength of the price increase during a 14-period by dividing the total upward movement by the total movement range. Similarly, I thought that if we divide the positive evaluations of the technical rating during a given period by the total evaluations, we could calculate the "momentum of the technical rating," which shows how often positive ratings have appeared during that period.
Below is the calculation formula.
1. Setting the Evaluation Period
Decide the period to calculate (e.g., 14 periods). This is denoted as `n`.
2. Total Positive Ratings of the Technical Rating
Calculate the total number of times the technical rating is evaluated as "strong buy" or "buy" during each period. This is called `positive_sum`.
3. Total Ratings
Count the total number of ratings (including buy, sell, and neutral) during the period. This is called `total_sum`.
4. Calculating the Upward Strength
Divide `positive_sum` by `total_sum` to calculate the ratio of positive ratings in the technical rating. This is called the "ratio of positive ratings."
The ratio of positive ratings, denoted as `P`, is calculated as follows:
P = positive_sum / total_sum
5. Calculating RRI
Following the calculation method of RSI, RRI is calculated by the following formula:
RRI = 100 - (100 / (1 + (P / (1 - P))))
As you can see, the calculation method is similar to that of RSI. Therefore, initially, I intended to name this indicator the Technical Rating RSI. However, RSI calculates based on the difference between the previous bar's price and the current bar's price, whereas this indicator calculates by summing the values of the technical ratings themselves. In the case of prices, if the difference between bars is zero, it indicates a flat market, but in the case of technical rating values, if 1.0 continues for two consecutive periods, it signifies an extremely strong buy rather than a flat market. For this reason, I decided that the calculation method could no longer be considered the same as the traditional RSI, and to avoid confusion, I chose to give this new indicator the name "Relative Rating Index" (RRI), as it provides a new type of numerical evaluation.
The information provided by this indicator is simple. When RRI exceeds 50, it means that more than 50% of the technical rating evaluations during the set period (I recommend 50 periods, but please determine the optimal value based on your timeframe) are buy evaluations. However, since there may be many false signals around exactly 50, I define it as buy-dominant when the value exceeds 60 and sell-dominant when it falls below 40. Additionally, if the graph itself is rising, it indicates that the buying momentum is strengthening, and if it is falling, it indicates that the selling momentum is increasing.
Furthermore, there are lines drawn at 90 and 10, but please note that unlike RSI, these do not indicate overbought or oversold conditions. When RRI exceeds 90, it means that over 90% of the technical rating evaluations during the specified period are buy evaluations, indicating an ongoing extremely strong buy trend. Until the RRI graph turns downward and falls below 90, it should rather be considered a buying opportunity.
With this new indicator, the technical rating becomes an indicator with depth, providing evaluations not only for the moment but over a specified period. I hope you find it helpful in your market analysis.

Uptrick: DPO Signal & Zone Indicator
## **Uptrick: DPO Signal & Zone Indicator**
### **Introduction:**
The **Uptrick: DPO Signal & Zone Indicator** is a sophisticated technical analysis tool tailored to provide insights into market momentum, identify potential trading signals, and recognize extreme market conditions. It leverages the Detrended Price Oscillator (DPO) to strip out long-term trends from price movements, allowing traders to focus on short-term fluctuations and cyclical behavior. The indicator integrates multiple components, including a Detrended Price Oscillator, a Signal Line, a Histogram, and customizable alert levels, to deliver a robust framework for market analysis and trading decision-making.
### **Detailed Breakdown:**
#### **1. Detrended Price Oscillator (DPO):**
- **Purpose and Functionality:**
- The DPO is designed to filter out long-term trends from the price data, isolating short-term price movements. This helps in understanding the cyclical patterns and momentum of an asset, allowing traders to detect periods of acceleration or deceleration that might be overlooked when focusing solely on long-term trends.
- **Calculation:**
- **Formula:** `dpo = close - ta.sma(close, smaLength)`
- **`close`:** The asset’s closing price for each period in the dataset.
- **`ta.sma(close, smaLength)`:** The Simple Moving Average (SMA) of the closing prices over a period defined by `smaLength`.
- The DPO is derived by subtracting the SMA value from the current closing price. This calculation reveals how much the current price deviates from the moving average, effectively detrending the price data.
- **Interpretation:**
- **Positive DPO Values:** Indicate that the current price is higher than the moving average, suggesting bullish market conditions and a potential upward trend.
- **Negative DPO Values:** Indicate that the current price is lower than the moving average, suggesting bearish market conditions and a potential downward trend.
- **Magnitude of DPO:** Reflects the strength of momentum. Larger positive or negative values suggest stronger momentum in the respective direction.
#### **2. Signal Line:**
- **Purpose and Functionality:**
- The Signal Line is a smoothed average of the DPO, intended to act as a reference point for generating trading signals. It helps to filter out short-term fluctuations and provides a clearer perspective on the prevailing trend.
- **Calculation:**
- **Formula:** `signalLine = ta.sma(dpo, signalLength)`
- **`ta.sma(dpo, signalLength)`:** The SMA of the DPO values over a period defined by `signalLength`.
- The Signal Line is calculated by applying a moving average to the DPO values. This smoothing process reduces noise and highlights the underlying trend direction.
- **Interpretation:**
- **DPO Crossing Above Signal Line:** Generates a buy signal, suggesting that short-term momentum is turning bullish relative to the longer-term trend.
- **DPO Crossing Below Signal Line:** Generates a sell signal, suggesting that short-term momentum is turning bearish relative to the longer-term trend.
- **Signal Line’s Role:** Provides a benchmark for assessing the strength of the DPO. The interaction between the DPO and the Signal Line offers actionable insights into potential entry or exit points.
#### **3. Histogram:**
- **Purpose and Functionality:**
- The Histogram visualizes the difference between the DPO and the Signal Line. It provides a graphical representation of momentum strength and direction, allowing traders to quickly gauge market conditions.
- **Calculation:**
- **Formula:** `histogram = dpo - signalLine`
- The Histogram is computed by subtracting the Signal Line value from the DPO value. Positive values indicate that the DPO is above the Signal Line, while negative values indicate that the DPO is below the Signal Line.
- **Interpretation:**
- **Color Coding:**
- **Green Bars:** Represent positive values, indicating bullish momentum.
- **Red Bars:** Represent negative values, indicating bearish momentum.
- **Width of Bars:** Indicates the strength of momentum. Wider bars signify stronger momentum, while narrower bars suggest weaker momentum.
- **Zero Line:** A horizontal gray line that separates positive and negative histogram values. Crosses of the histogram through this zero line can signal shifts in momentum direction.
#### **4. Alert Levels:**
- **Purpose and Functionality:**
- Alert levels define specific thresholds to identify extreme market conditions, such as overbought and oversold states. These levels help traders recognize potential reversal points and extreme market conditions.
- **Inputs:**
- **`alertLevel1`:** Defines the upper threshold for identifying overbought conditions.
- **Default Value:** 0.5
- **`alertLevel2`:** Defines the lower threshold for identifying oversold conditions.
- **Default Value:** -0.5
- **Interpretation:**
- **Overbought Condition:** When the DPO exceeds `alertLevel1`, indicating that the market may be overbought. This condition suggests that the asset could be due for a correction or reversal.
- **Oversold Condition:** When the DPO falls below `alertLevel2`, indicating that the market may be oversold. This condition suggests that the asset could be poised for a rebound or reversal.
#### **5. Visual Elements:**
- **DPO and Signal Line Plots:**
- **DPO Plot:**
- **Color:** Blue
- **Width:** 2 pixels
- **Purpose:** To visually represent the deviation of the current price from the moving average.
- **Signal Line Plot:**
- **Color:** Red
- **Width:** 1 pixel
- **Purpose:** To provide a smoothed reference for the DPO and generate trading signals.
- **Histogram Plot:**
- **Color Coding:**
- **Green:** For positive values, signaling bullish momentum.
- **Red:** For negative values, signaling bearish momentum.
- **Style:** Histogram bars are displayed with varying width to represent the strength of momentum.
- **Zero Line:** A gray horizontal line separating positive and negative histogram values.
- **Overbought/Oversold Zones:**
- **Background Colors:**
- **Green Shading:** Applied when the DPO exceeds `alertLevel1`, indicating an overbought condition.
- **Red Shading:** Applied when the DPO falls below `alertLevel2`, indicating an oversold condition.
- **Horizontal Lines:**
- **Dotted Green Line:** At `alertLevel1`, marking the upper alert threshold.
- **Dotted Red Line:** At `alertLevel2`, marking the lower alert threshold.
- **Purpose:** To provide clear visual cues for extreme market conditions, aiding in the identification of potential reversal points.
#### **6. Trading Signals and Alerts:**
- **Buy Signal:**
- **Trigger:** When the DPO crosses above the Signal Line.
- **Visual Representation:** A "BUY" label appears below the price bar in the specified buy color.
- **Purpose:** Indicates a potential buying opportunity as short-term momentum turns bullish.
- **Sell Signal:**
- **Trigger:** When the DPO crosses below the Signal Line.
- **Visual Representation:** A "SELL" label appears above the price bar in the specified sell color.
- **Purpose:** Indicates a potential selling opportunity as short-term momentum turns bearish.
- **Overbought/Oversold Alerts:**
- **Overbought Alert:** Triggered when the DPO crosses below `alertLevel1`.
- **Oversold Alert:** Triggered when the DPO crosses above `alertLevel2`.
- **Visual Representation:** Labels "OVERBOUGHT" and "OVERSOLD" appear with distinctive colors and sizes to highlight extreme conditions.
- **Purpose:** To signal potential reversal points and extreme market conditions that may lead to price corrections or trend reversals.
- **Alert Conditions:**
- **DPO Cross Above Signal Line:** Alerts traders when the DPO crosses above the Signal Line, generating a buy signal.
- **DPO Cross Below Signal Line:** Alerts traders when the DPO crosses below the Signal Line, generating a sell signal.
- **DPO Above Upper Alert Level:** Alerts when the DPO is above `alertLevel1`, indicating an overbought condition.
- **DPO Below Lower Alert Level:** Alerts when the DPO is below `alertLevel2`, indicating an oversold condition.
- **Purpose:** To provide real-time notifications of significant market events, enabling traders to make informed decisions promptly.
### **Practical Applications:**
#### **1. Trend Following Strategies:**
- **Objective:**
- To capture and ride the prevailing market trends by entering trades that align with the direction of the momentum.
- **How to Use:**
- Monitor buy and sell signals generated by the DPO crossing the Signal Line. A buy signal suggests a bullish trend and a potential long trade, while a sell signal suggests a bearish trend and a potential short trade.
- Use the Histogram to confirm the strength of the trend. Expanding green bars indicate strong bullish momentum, while expanding red bars indicate strong bearish momentum.
- **Advantages:**
- Helps traders stay aligned with the market trend, increasing the likelihood of capturing substantial price moves.
#### **2. Reversal Trading:**
- **Objective:**
- To identify potential market reversals
by detecting overbought and oversold conditions.
- **How to Use:**
- Look for overbought and oversold signals based on the DPO crossing `alertLevel1` and `alertLevel2`. These conditions suggest that the market may be due for a reversal.
- Confirm reversal signals with the Histogram. A decrease in histogram bars (from green to red or vice versa) may support the reversal hypothesis.
- **Advantages:**
- Provides early warnings of potential market reversals, allowing traders to position themselves before significant price changes occur.
#### **3. Momentum Analysis:**
- **Objective:**
- To gauge the strength and direction of market momentum for making informed trading decisions.
- **How to Use:**
- Analyze the Histogram to assess momentum strength. Positive and expanding histogram bars indicate increasing bullish momentum, while negative and expanding bars suggest increasing bearish momentum.
- Use momentum insights to validate or question existing trading positions and strategies.
- **Advantages:**
- Offers valuable information about the market's momentum, helping traders confirm the validity of trends and trading signals.
### **Customization and Flexibility:**
The **Uptrick: DPO Signal & Zone Indicator** offers extensive customization options to accommodate diverse trading preferences and market conditions:
- **SMA Length and Signal Line Length:**
- Adjust the `smaLength` and `signalLength` parameters to control the sensitivity and responsiveness of the DPO and Signal Line. Shorter lengths make the indicator more responsive to price changes, while longer lengths provide smoother, less volatile signals.
- **Alert Levels:**
- Modify `alertLevel1` and `alertLevel2` to fit varying market conditions and volatility. Setting these levels appropriately helps tailor the indicator to different asset classes and trading strategies.
- **Color and Shape Customization:**
- Customize the colors and sizes of buy/sell signals, histogram bars, and alert levels to enhance visual clarity and align with personal preferences. This customization helps ensure that the indicator integrates seamlessly with a trader's charting setup.
### **Conclusion:**
The **Uptrick: DPO Signal & Zone Indicator** is a multifaceted analytical tool that combines the power of the Detrended Price Oscillator with customizable visual elements and alert levels to deliver a comprehensive approach to market analysis. By offering insights into momentum strength, trend direction, and potential reversal points, this indicator equips traders with valuable information to make informed decisions and enhance their trading strategies. Its flexibility and customization options ensure that it can be adapted to various trading styles and market conditions, making it a versatile addition to any trader's toolkit.

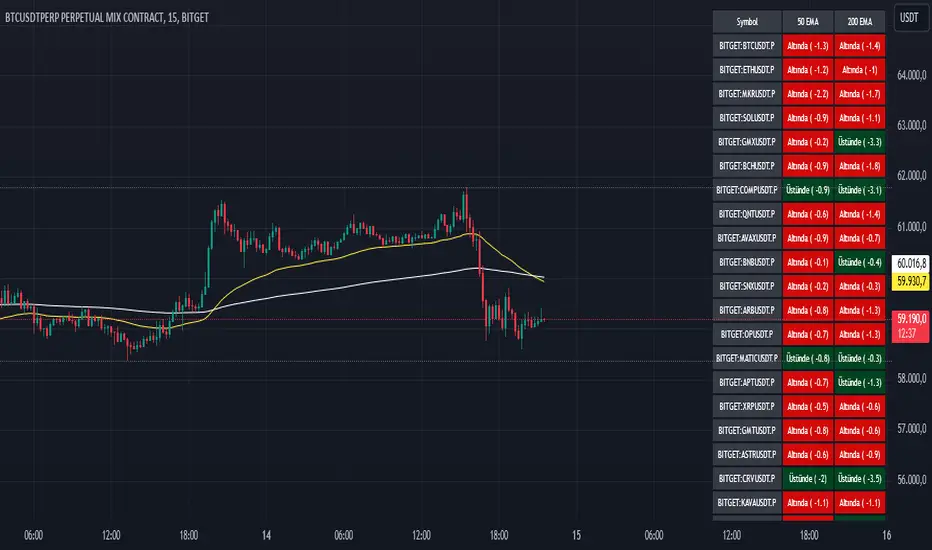
EMA 50 200 Multi-Scanner
EMA 50 200 Multi-Scanner: İndikatör Açıklaması ve Kullanım Kılavuzu
"EMA 50 200 Multi-Scanner" indikatörü, birden fazla kripto para çiftini farklı zaman dilimlerinde tarayan güçlü bir teknik analiz aracıdır. Bu indikatör, 50 periyotluk ve 200 periyotluk Üssel Hareketli Ortalamalar (EMA) arasındaki ilişkiyi analiz ederek, çeşitli zaman dilimlerinde potansiyel alım ve satım fırsatlarını tespit etmenizi sağlar. Hem kısa vadeli trendleri hem de uzun vadeli trendleri gözlemleyerek, piyasa koşullarına uygun stratejiler geliştirmenize yardımcı olur.
Ne İşe Yarar?
Trend Yönünü Belirleme: İndikatör, seçtiğiniz kripto para çiftlerinin her birinde 50 EMA ve 200 EMA arasındaki ilişkiyi analiz eder. Bu analiz, hem kısa vadeli hem de uzun vadeli trendlerin yönünü belirlemenize olanak tanır.
Zaman Dilimleri Arası Analiz: Farklı zaman dilimlerinde çalışabilen bu indikatör, günlük, saatlik, dakikalık gibi çeşitli periyotlarda trendleri ve fiyat hareketlerini incelemenizi sağlar. Bu, hem kısa vadeli ticaret fırsatlarını yakalamak hem de uzun vadeli yatırım kararlarını desteklemek için idealdir.
Alım/Satım Sinyalleri: İndikatör, fiyatın 50 EMA ve 200 EMA ile olan ilişkisini temel alarak alım ve satım sinyalleri üretir. Bu sinyaller, piyasa trendlerinden yararlanarak pozisyon açma veya kapama kararlarınızı destekler.
Dinamik Destek ve Direnç Seviyeleri: EMA seviyeleri, aynı zamanda dinamik destek ve direnç seviyeleri olarak kullanılabilir. Fiyatın bu seviyelere yaklaşması, potansiyel geri dönüş noktalarını veya trendin devamını işaret edebilir.
Nasıl Kullanılır?
İndikatör Ayarları:
EMA Uzunlukları: İhtiyacınıza göre 50 EMA ve 200 EMA'nın periyot uzunluklarını ayarlayabilirsiniz.
Renkler: EMA çizgilerinin rengini tercihinize göre özelleştirebilirsiniz.
Negatif Değerleri Gösterme: Fiyatın EMA seviyelerinin altında olduğu durumlarda negatif değerleri görmek isterseniz, bu özelliği aktif hale getirebilirsiniz.
Semboller: İndikatör, önceden tanımlanmış kripto para çiftleri üzerinde çalışır. Her bir sembol, seçtiğiniz zaman diliminde taranır ve sonuçlar gösterilir. Gereksinimlerinize göre bu sembolleri seçebilir veya çıkarabilirsiniz.
Zaman Dilimleri: İndikatör, TradingView platformundaki tüm zaman dilimlerinde çalışır. Bu, hem kısa vadeli hem de uzun vadeli yatırımcılar için esnek bir analiz olanağı sunar.
Al/Sat Sinyalleri:
Alım Sinyali: 50 EMA, 200 EMA'yı yukarı yönde kestiğinde ve fiyat bu kesişimin üzerinde olduğunda yeşil bir "BUY" etiketi ile gösterilir.
Satım Sinyali: 50 EMA, 200 EMA'yı aşağı yönde kestiğinde ve fiyat bu kesişimin altında olduğunda kırmızı bir "SELL" etiketi ile gösterilir.
"EMA 50 200 Multi-Scanner," çoklu zaman dilimlerinde ve kripto para çiftlerinde trend takibi yapmak isteyen yatırımcılar için etkili ve kullanımı kolay bir araçtır. Piyasa koşullarını daha iyi anlamak ve ticaret stratejilerinizi optimize etmek için bu indikatörü kullanabilirsiniz.
-------------
The "EMA 50 200 Multi-Scanner" is a powerful technical analysis tool designed to scan multiple cryptocurrency pairs across different timeframes. This indicator analyzes the relationship between the 50-period and 200-period Exponential Moving Averages (EMA) to help you identify potential buying and selling opportunities across various timeframes. It enables you to observe both short-term and long-term trends, aiding in the development of market-appropriate strategies.
Purpose
Trend Direction Identification: The indicator analyzes the relationship between the 50 EMA and 200 EMA for each selected cryptocurrency pair, allowing you to determine the direction of both short-term and long-term trends.
Multi-Timeframe Analysis: This indicator can operate across different timeframes, such as daily, hourly, and minute-based periods, allowing you to examine trends and price movements in multiple contexts. It is ideal for capturing short-term trading opportunities and supporting long-term investment decisions.
Buy/Sell Signals: The indicator generates buy and sell signals based on the relationship between the price and the 50 EMA and 200 EMA. These signals support your decision-making process by highlighting opportunities to open or close positions based on market trends.
Dynamic Support and Resistance Levels: The EMA levels can also serve as dynamic support and resistance levels. When the price approaches these levels, it can indicate potential reversal points or trend continuations.
How to Use
Indicator Settings:
EMA Lengths: Adjust the period lengths of the 50 EMA and 200 EMA to suit your needs.
Colors: Customize the colors of the EMA lines according to your preferences.
Show Negative Values: If you want to see negative values when the price is below the EMA levels, you can enable this feature.
Symbols: The indicator works on predefined cryptocurrency pairs. Each symbol is scanned within the selected timeframe, and results are displayed. You can select or deselect symbols according to your requirements.
Timeframes: The indicator functions across all timeframes available on the TradingView platform, offering flexible analysis for both short-term and long-term traders.
Buy/Sell Signals:
Buy Signal: A green "BUY" label is shown when the 50 EMA crosses above the 200 EMA and the price is above this crossover.
Sell Signal: A red "SELL" label is shown when the 50 EMA crosses below the 200 EMA and the price is below this crossover.
The "EMA 50 200 Multi-Scanner" is an effective and user-friendly tool for traders looking to track trends across multiple timeframes and cryptocurrency pairs. You can use this indicator to gain a better understanding of market conditions and optimize your trading strategies.
Tick CVD [Kioseff Trading]Hello!
This script "Tick CVD" employs live tick data to calculate CVD and volume delta! No tick chart required.
Features
Live price ticks are recorded
CVD calculated using live ticks
Delta calculated using live ticks
Tick-based HMA, WMA, EMA, or SMA for CVD and price
Key tick levels (S/R CVD & price) are recorded and displayed
Price/CVD displayable as candles or lines
Polylines are used - data visuals are not limited to 500 points.
Efficiency mode - remove all the bells and whistles to capitalize on efficiently calculated/displayed tick CVD and price
How it works
While historical tick-data isn't available to non-professional subscribers, live tick data is programmatically accessible. Consequently, this indicator records live tick data to calculate CVD, delta, and other metrics for the user!
Generally, Pine Scripts use the following rules to calculate volume/price-related metrics:
Bullish Volume: When the close price is greater than the open price.
Bearish Volume: When the close price is less than the open price.
This script, however, improves on that logic by utilizing live ticks. Instead of relying on time-series charts, it records up ticks as buying volume and down ticks as selling volume. This allows the script to create a more accurate CVD, delta, or price tick chart by tracking real-time buying and selling activity.
Price can tick fast; therefore, tick aggregation can occur. While tick aggregation isn't necessarily "incorrect", if you prefer speed and efficiency it's advised to enable "efficiency mode" in a fast market.
The image above highlights the tick CVD and price tick graph!
Green price tick graph = price is greater than its origin point (first script load)
Red price tick graph = price is less than its origin point
Blue tick CVD graph = CVD, over the calculation period, is greater than 0.
Red tick CVD graph = CVD is less than 0 over the calculation period.
The image above explains the right-oriented scales. The upper scale is for the price graph and the lower scale for the CVD graph.
The image above explains the circles superimposed on the scale lines for the price graph and the CVD graph.
The image above explains the "wavy" lines shown by the indicator. The wavy lines correspond to tick delta - whether the recorded tick was an uptick or down tick and whether buy volume or sell volume transpired.
The image above explains the blue/red boxes displayed by the indicator. The boxes offer an alternative visualization of tick delta, including the magnitude of buying/selling volume for the recorded tick.
Blue boxes = buying volume
Red boxes = selling volume
Bright blue = high buying volume (relative)
Bright red = high selling volume (relative)
Dim blue = low buying volume (relative)
Dim red = low selling volume (relative)
The numbers displayed in the box show the numbered tick and the volume delta recorded for the tick.
The image above further explains visuals for the CVD graph.
Dotted red lines indicate key CVD peaks, while dotted blue lines indicate key CVD bottoms.
The white dotted line reflects the CVD average of your choice: HMA, WMA, EMA, SMA.
The image above offers a similar explanation of visuals for the price graph.
The image above offers an alternative view for the indicator!
The image above shows the indicator when efficiency mode is enabled. When trading a fast market, enabling efficiency mode is advised - the script will perform quicker.
Of course, thank you to @RicardoSantos for his awesome library I use in almost every script :D
Thank you for checking this out!

Volume Positive & Negative Levels [ChartPrime]Volume Positive & Negative Levels
Overview:
The Volume Positive & Negative Levels indicator by ChartPrime is designed to provide traders with a clear visualization of volume activity across different price levels. By plotting volume levels as histograms, this tool helps identify significant areas of buying (positive volume) and selling (negative volume) pressure, enhancing the ability to spot potential support and resistance zones.
Key Features:
⯁ Lookback Period:
- The `lookbackPeriod` parameter, set to 500 bars, determines the range over which the volume analysis is conducted, ensuring a comprehensive view of the market’s volume activity. The maximum lookback period is 500 bars or the bars currently visible on the chart, whichever is smaller.
⯁ Dynamic Volume Calculation:
- Volume is calculated dynamically based on the price action, with positive volume indicating buying pressure (close > open) and negative volume indicating selling pressure (close < open).
⯁ Color Coding for Clarity:
- Positive Volume: Represented with a distinct color (`#ad9a2c`), making it easy to identify areas of buying interest.
- Negative Volume: Highlighted with another color (`#ad2cad`), simplifying the detection of selling pressure.
Volume Threshold and Bins:
- The indicator allows users to set a volume threshold (`volume_level`) to highlight significant volume levels, with the default set at 70.
- The number of bins (`numBins`) defines the granularity of the volume profile, with a higher number providing more detail.
⯁ Volume Profile Visualization:
- The volume profile is plotted as a histogram, with the height of each bar proportional to the volume at that price level. This visualization helps in quickly assessing the strength of volume at various price points.
⯁ Interactive Labels and Threshold Indicators:
- Labels: The indicator uses labels to mark significant volume levels, providing quick reference points for traders.
- Threshold Lines: Lines are drawn at specified volume thresholds, with colors and widths dynamically adjusted based on the volume levels.
⯁ User Inputs:
- Volume Threshold (`volume_level`): Sets the minimum volume required to highlight significant levels.
- Number of Bins (`numBins`): Determines the resolution of the volume profile.
- Line Width (`line_withd`): Specifies the width of the lines used in the visualization.
The Volume Positive & Negative Levels indicator is a powerful tool for traders looking to gain deeper insights into market dynamics. By providing a clear visual representation of volume activity across different price levels, it helps traders identify key support and resistance zones, spot trends, and make more informed trading decisions. Whether you are a day trader or a swing trader, this indicator enhances your ability to analyze volume data effectively, improving your overall trading strategy.

ICT Turtle Soup | Flux Charts💎 GENERAL OVERVIEW
Introducing our new ICT Turtle Soup Indicator! This indicator is built around the ICT "Turtle Soup" model. The strategy has 5 steps for execution which are described in this write-up. For more information about the process, check the "HOW DOES IT WORK" section.
Features of the new ICT Turtle Soup Indicator :
Implementation of ICT's Turtle Soup Strategy
Adaptive Entry Method
Customizable Execution Settings
Customizable Backtesting Dashboard
Alerts for Buy, Sell, TP & SL Signals
📌 HOW DOES IT WORK ?
The ICT Turtle Soup strategy may have different implementations depending on the selected method of the trader. This indicator's implementation is described as :
1. Mark higher timerame liquidity zones.
Liquidity zones are where a lot of market orders sit in the chart. They are usually formed from the long / short position holders' "liquidity" levels. There are various ways to find them, most common one being drawing them on the latest high & low pivot points in the chart, which this indicator does.
2. Mark current timeframe market structure.
The market structure is the current flow of the market. It tells you if the market is trending right now, and the way it's trending towards. It's formed from swing higs, swing lows and support / resistance levels.
3. Wait for market to make a liquidity grab on the higher timeframe liquidity zone.
A liquidity grab is when the marked liquidity zones have a false breakout, which means that it gets broken for a brief amount of time, but then price falls back to it's previous position.
4. Buyside liquidity grabs are "Short" entries and Sellside liquidity grabs are "Long" entries by default.
5. Wait for the market-structure shift in the current timeframe for entry confirmation.
A market-structure shift happens when the current market structure changes, usually when a new swing high / swing low is formed. This indicator uses it as a confirmation for position entry as it gives an insight of the new trend of the market.
6. Place Take-Profit and Stop-Loss levels according to the risk ratio.
This indicator uses "Average True Range" when placing the stop-loss & take-profit levels. Average True Range calculates the average size of a candle and the indicator places the stop-loss level using ATR times the risk setting determined by the user, then places the take-profit level trying to keep a minimum of 1:1 risk-reward ratio.
This indicator follows these steps and inform you step by step by plotting them in your chart.
🚩UNIQUENESS
This indicator is an all-in-one suit for the ICT's Turtle Soup concept. It's capable of plotting the strategy, giving signals, a backtesting dashboard and alerts feature. It's designed for simplyfing a rather complex strategy, helping you to execute it with clean signals. The backtesting dashboard allows you to see how your settings perform in the current ticker. You can also set up alerts to get informed when the strategy is executable for different tickers.
⚙️SETTINGS
1. General Configuration
MSS Swing Length -> The swing length when finding liquidity zones for market structure-shift detection.
Higher Timeframe -> The higher timeframe to look for liquidity grabs. This timeframe setting must be higher than the current chart's timeframe for the indicator to work.
Breakout Method -> If "Wick" is selected, a bar wick will be enough to confirm a market structure-shift. If "Close" is selected, the bar must close above / below the liquidity zone to confirm a market structure-shift.
Entry Method ->
"Classic" : Works as described on the "HOW DOES IT WORK" section.
"Adaptive" : When "Adaptive" is selected, the entry conditions may chance depending on the current performance of the indicator. It saves the entry conditions and the performance of the past entries, then for the new entries it checks if it predicted the liquidity grabs correctly with the current setup, if so, continues with the same logic. If not, it changes behaviour to reverse the entries from long / short to short / long.
2. TP / SL
TP / SL Method -> If "Fixed" is selected, you can adjust the TP / SL ratios from the settings below. If "Dynamic" is selected, the TP / SL zones will be auto-determined by the algorithm.
Risk -> The risk you're willing to take if "Dynamic" TP / SL Method is selected. Higher risk usually means a better winrate at the cost of losing more if the strategy fails. This setting is has a crucial effect on the performance of the indicator, as different tickers may have different volatility so the indicator may have increased performance when this setting is correctly adjusted.

Market Sentiment Technicals [LuxAlgo]The Market Sentiment Technicals indicator synthesizes insights from diverse technical analysis techniques, including price action market structures, trend indicators, volatility indicators, momentum oscillators, and more.
The indicator consolidates the evaluated outputs from these techniques into a singular value and presents the combined data through an oscillator format, technical rating, and a histogram panel featuring the sentiment of each component alongside the overall sentiment.
🔶 USAGE
The Market Sentiment Technicals indicator is a tool able to swiftly and easily gauge market sentiment by consolidating the individual sentiment from multiple technical analysis techniques applied to market data into a single value, allowing users to asses if the market is uptrending, consolidating, or downtrending.
The tool includes various components and presentation formats, each described in the sub-sections below.
🔹Indicators Sentiment Panel
The indicators sentiment panel provides normalized sentiment scores for each supported indicator, along with a synthesized representation derived from the average of all individual normalized sentiments.
🔹Market Sentiment Meter
The market sentiment meter is obtained from the synthesized representation derived from the average of all individual normalized sentiments. It allows users to quickly and easily gauge the overall market sentiment.
🔹Market Sentiment Oscillator
The market sentiment oscillator provides a visual means to monitor the current and historical strength of the market. It assists in identifying the trend direction, trend momentum, and overbought and oversold conditions, aiding in the anticipation of potential trend reversals.
Divergence occurs when there is a difference between what the price action is indicating and what the market sentiment oscillator is indicating, helping traders assess changes in the price trend.
🔶 DETAILS
The indicator employs a range of technical analysis techniques to interpret market data. Each group of indicators provides valuable insights into different aspects of market behavior.
🔹Momentum Indicators
Momentum indicators assess the speed and change of price movements, often indicating whether a trend is strengthening or weakening.
Relative Strength Index (RSI): Measures the magnitude of recent price changes to evaluate overbought or oversold conditions.
Stochastic %K: Compares the closing price to the range over a specified period to identify potential reversal points.
Stochastic RSI Fast: Combines features of Stochastic oscillators and RSI to gauge both momentum and overbought/oversold levels efficiently.
Commodity Channel Index (CCI): Measures the deviation of an asset's price from its statistical average to determine trend strength and overbought and oversold conditions.
Bull Bear Power: Evaluates the strength of buying and selling pressure in the market.
🔹Trend Indicators
Trend indicators help traders identify the direction of a market trend.
Moving Averages: Provides a smoothed representation of the underlying price data, aiding in trend identification and analysis.
Bollinger Bands: Consists of a middle band (typically a simple moving average) and upper and lower bands, which represent volatility levels of the market.
Supertrend: A trailing stop able to identify the current direction of the trend.
Linear Regression: Fits a straight line to past data points to predict future price movements and identify trend direction.
🔹Market Structures
Market Structures: Analyzes the overall pattern of price movements, including Break of Structure (BOS), Market Structure Shifts (MSS), also referred to as Change of Character (CHoCH), aiding in identifying potential market turning and continuation points.
🔹The Normalization Technique
The normalization technique employed for trend indicators relies on buy-sell signals. The script tracks price movements and normalizes them based on these signals.
normalize(buy, sell, smooth)=>
var os = 0
var float max = na
var float min = na
os := buy ? 1 : sell ? -1 : os
max := os > os ? close : os < os ? max : math.max(close, max)
min := os < os ? close : os > os ? min : math.min(close, min)
ta.sma((close - min)/(max - min), smooth) * 100
In this Pine Script snippet:
The variable os tracks market sentiment, taking a value of 1 for buy signals and -1 for sell signals, indicating bullish and bearish sentiments, respectively.
max and min are used to identify extremes in sentiment and are updated based on changes in os . When market sentiment shifts from buying to selling (or vice versa), max and min adjust accordingly.
Normalization is achieved by comparing current price levels to historical extremes in sentiment. The result is smoothed by default using a 3-period simple moving average. Users have the option to customize the smoothing period via the script settings input menu.
🔶 SETTINGS
🔹Generic Settings
Timeframe: This option selects the timeframe for calculating sentiment. If a timeframe lower than the chart's is chosen, calculations will be based on the chart's timeframe.
Horizontal Offset: Determines the distance at which the visual components of the indicator will be displayed from the primary chart.
Gradient Colors: Allows customization of gradient colors.
🔹Indicators Sentiment Panel
Indicators Sentiment Panel: Toggle the visibility of the indicators sentiment panel.
Panel Height: Determines the height of the panel.
🔹Market Sentiment Meter
Market Sentiment Meter: Toggle the visibility of the market sentiment meter (technical ratings in the shape of a speedometer).
🔹Market Sentiment Oscillator
Market Sentiment Oscillator: Toggle the visibility of the market sentiment oscillator.
Show Divergence: Enables detection of divergences based on the selected option.
Oscillator Line Width: Customization option for the line width.
Oscillator Height: Determines the height of the oscillator.
🔹Settings for Individual Components
In general,
Source: Determines the data source for calculations.
Length: The period to be used in calculations.
Smoothing: Degree of smoothness of the evaluated values.
🔹Normalization Settings - Trend Indicators
Smoothing: The period used in smoothing normalized values, where normalization is applied to moving averages, Bollinger Bands, Supertrend, VWAP bands, and market structures.
🔶 LIMITATIONS
Like any technical analysis tool, the Market Sentiment Technicals indicator has limitations. It's based on historical data and patterns, which may not always accurately predict future market movements. Additionally, market sentiment can be influenced by various factors, including economic news, geopolitical events, and market psychology, which may not be fully captured by technical analysis alone.

Intelle_city - World Cycle - Ath & Atl - Logarithmic - Strategy.Overview
Indicators: Strategy !
INTELLECT_city - World Cycle - ATH & ATL - Timeframe 1D and 1W - Logarithmic - Strategy - The Pi Cycle Top and Bottom Oscillator is an adaptation of the original Pi Cycle Top chart. It compares the 111-Day Moving Average circle and the 2 * 350-Day Moving Average circle of Bitcoin’s Price. These two moving averages were selected as 350 / 111 = 3.153; An approximation of the important mathematical number Pi.
When the 111-Day Moving Average circle reaches the 2 * 350-Day Moving Average circle, it indicates that the market is becoming overheated. That is because the mid time frame momentum reference of the 111-Day Moving Average has caught up with the long timeframe momentum reference of the 2 * 350-Day Moving Average.
Historically this has occurred within 3 days of the very top of each market cycle.
When the 111 Day Moving Average circle falls back beneath the 2 * 350 Day Moving Average circle, it indicates that the market momentum of that cycle is significantly cooling down. The oscillator drops down into the lower green band shown where the 111 Day Moving Average is moving at a 75% discount relative to the 2 * 350 Day Moving Average.
Historically, this has highlighted broad areas of bear market lows.
IMPORTANT: You need to set a LOGARITHMIC graph. (The function is located at the bottom right of the screen)
IMPORTANT: The INTELLECT_city indicator is made for a buy-sell strategy; there is also a signal indicator from INTELLECT_city
IMPORTANT: The Chart shows all cycles, both buying and selling.
IMPORTANT: Suitable timeframes are 1 daily (recommended) and 1 weekly
-----------------------------
Описание на русском:
-----------------------------
Обзор индикатора
INTELLECT_city - World Cycle - ATH & ATL - Timeframe 1D and 1W - Logarithmic - Strategy - Логарифмический - Сигнал - Осциллятор вершины и основания цикла Пи представляет собой адаптацию оригинального графика вершины цикла Пи. Он сравнивает круг 111-дневной скользящей средней и круг 2 * 350-дневной скользящей средней цены Биткойна. Эти две скользящие средние были выбраны как 350/111 = 3,153; Приближение важного математического числа Пи.
Когда круг 111-дневной скользящей средней достигает круга 2 * 350-дневной скользящей средней, это указывает на то, что рынок перегревается. Это происходит потому, что опорный моментум среднего временного интервала 111-дневной скользящей средней догнал опорный момент импульса длинного таймфрейма 2 * 350-дневной скользящей средней.
Исторически это происходило в течение трех дней после вершины каждого рыночного цикла.
Когда круг 111-дневной скользящей средней опускается ниже круга 2 * 350-дневной скользящей средней, это указывает на то, что рыночный импульс этого цикла значительно снижается. Осциллятор опускается в нижнюю зеленую полосу, показанную там, где 111-дневная скользящая средняя движется со скидкой 75% относительно 2 * 350-дневной скользящей средней.
Исторически это высветило широкие области минимумов медвежьего рынка.
ВАЖНО: Выставлять нужно ЛОГАРИФМИЧЕСКИЙ график. (Находиться функция с правой нижней части экрана)
ВАЖНО: Индикатор INTELLECT_city сделан для стратегии покупок продаж, есть также и сигнальный от INTELLECT_сity
ВАЖНО: На Графике видны все циклы, как на покупку так и на продажу.
ВАЖНО: Подходящие таймфреймы 1 дневной (рекомендовано) и 1 недельный
-----------------------------
Beschreibung - Deutsch
-----------------------------
Indikatorübersicht
INTELLECT_city – Weltzyklus – ATH & ATL – Zeitrahmen 1T und 1W – Logarithmisch – Strategy – Der Pi-Zyklus-Top- und Bottom-Oszillator ist eine Anpassung des ursprünglichen Pi-Zyklus-Top-Diagramms. Er vergleicht den 111-Tage-Gleitenden-Durchschnittskreis und den 2 * 350-Tage-Gleitenden-Durchschnittskreis des Bitcoin-Preises. Diese beiden gleitenden Durchschnitte wurden als 350 / 111 = 3,153 ausgewählt; eine Annäherung an die wichtige mathematische Zahl Pi.
Wenn der 111-Tage-Gleitenden-Durchschnittskreis den 2 * 350-Tage-Gleitenden-Durchschnittskreis erreicht, deutet dies darauf hin, dass der Markt überhitzt. Das liegt daran, dass der Momentum-Referenzwert des 111-Tage-Gleitenden-Durchschnitts im mittleren Zeitrahmen den Momentum-Referenzwert des 2 * 350-Tage-Gleitenden-Durchschnitts im langen Zeitrahmen eingeholt hat.
Historisch gesehen geschah dies innerhalb von 3 Tagen nach dem Höhepunkt jedes Marktzyklus.
Wenn der Kreis des 111-Tage-Durchschnitts wieder unter den Kreis des 2 x 350-Tage-Durchschnitts fällt, deutet dies darauf hin, dass die Marktdynamik dieses Zyklus deutlich nachlässt. Der Oszillator fällt in das untere grüne Band, in dem der 111-Tage-Durchschnitt mit einem Abschlag von 75 % gegenüber dem 2 x 350-Tage-Durchschnitt verläuft.
Historisch hat dies breite Bereiche mit Tiefstständen in der Baisse hervorgehoben.
WICHTIG: Sie müssen ein logarithmisches Diagramm festlegen. (Die Funktion befindet sich unten rechts auf dem Bildschirm)
WICHTIG: Der INTELLECT_city-Indikator ist für eine Kauf-Verkaufs-Strategie konzipiert; es gibt auch einen Signalindikator von INTELLECT_city
WICHTIG: Das Diagramm zeigt alle Zyklen, sowohl Kauf- als auch Verkaufszyklen.
WICHTIG: Geeignete Zeitrahmen sind 1 täglich (empfohlen) und 1 wöchentlich

Volume Delta [hapharmonic]Volume Delta: Volume Delta is an indicator that simplifies how you analyze trading volumes and the percentage of buy-sell activities effortlessly.
As a trader or market analyst, understanding underlying volume and trade flows is critical. The Volume Delta indicator provides thorough insight into both the total volume and the percentage of buying versus selling within the current candlestick. This information is pivotal for those looking to gauge market momentum and sentiment more effectively.
Additionally, the Volume Delta indicator can plot the candlestick colors based on the percentage of the dominant buying or selling volume. The area between the open and close prices of the candlestick is considered 100% and fills with colors corresponding to the predominant volume at that percentage.
Volume Delta also integrates the concept of Net volume. This component is crucial as it reveals the real market sentiment by calculating the difference between the volume of trades executed at an uptick and those at a downtick.
🟠 Overview
This indicator now displays in two layouts. Recently, Tradingview introduced the "force_overlay=true" function in Pine Script , allowing plots to be moved to the main chart. Thus, all displays are from the same indicator.
🟠 USAGE
From the data displayed in 'plot.style_columns' , the peak area represents the entire volume, accounting for 100%. Within this area, there are two color levels indicating volume. If one type of volume, whether buying or selling, exceeds the other, the larger volume will be positioned behind and the smaller in front. This arrangement prevents the scenario where a higher buying volume obscures the smaller selling volume. Therefore, the two colors can be switched between the front and the back as needed.
As you can see, the 12 and 26-day Exponential Moving Averages (EMAs) are used, with the Volume Confirmation Length set at 6. Therefore, the crossing of the EMAs proceeds normally, but it is highlighted with three triangular arrows to indicate a high likelihood of a valid crossover. However, if the volume is insufficient, these markers won't be displayed, although the EMA crossover will still occur as usual. This can be useful for using volume to verify the significance of the EMA crossover.
🟠 Setting
If you enable the label, please be aware that the chart size will shrink, causing the candlestick display to become unclear. Therefore, you might need to select "Logarithmic" at the bottom right of your screen, or for mobile applications, press and hold on the price scale and choose "Logarithmic" to adjust the scale appropriately.
Enjoy!

Enhanced Forex IndicatorDescription of the "Enhanced Forex Indicator"
The "Enhanced Forex Indicator" is designed for traders who want a comprehensive technical analysis tool on the TradingView platform. This script integrates Exponential Moving Averages (EMAs), support and resistance zones, and candlestick pattern recognition to provide actionable trading signals, particularly useful for Forex and other financial markets. The script is suitable for intraday trading and swing trading.
Components of the Indicator
Exponential Moving Averages (EMAs):
Short EMA (Blue Line): Faster responding average, good for identifying recent trend changes.
Long EMA (Red Line): Slower moving average, helps in confirming longer-term trends.
Support and Resistance Zones:
Resistance Zone (Red): Area where potential selling pressure could overcome buying pressure, halting price increases temporarily or reversing them.
Support Zone (Green): Area where potential buying pressure could overcome selling pressure, supporting prices and preventing them from falling further.
Candlestick Patterns:
Bullish Engulfing Pattern (Green Triangle Up 'BE'): Suggests a potential upward reversal or start of a bullish trend.
Bearish Engulfing Pattern (Red Triangle Down 'BE'): Indicates a potential downward reversal or start of a bearish trend.
Buy/Sell Signals:
Buy Signal (Green Label 'BUY'): Triggered when the price is above both EMAs and a bullish engulfing pattern is detected.
Sell Signal (Red Label 'SELL'): Triggered when the price is below both EMAs and a bearish engulfing pattern is detected.
Trading Setup:
Entry: Consider entering a buy position when the 'BUY' signal appears, indicating bullish conditions. Enter a sell position when the 'SELL' signal appears, indicating bearish conditions.
Exit: Look for closing signals opposite your entry or use predefined take profit and stop loss levels. For instance, exit a buy position on a 'SELL' signal or when the price drops below the support zone.
Risk Management:
Set stop losses just below the support zone for buy orders and above the resistance zone for sell orders to protect against significant losses.
Adjust position sizes according to your risk tolerance and account balance.
Considerations:
Use this indicator in conjunction with other analysis tools and fundamental data to confirm signals and strengthen your trading strategy.
Periodically backtest the strategy based on this indicator to ensure its effectiveness in current market conditions.
Optimization:
Adjust the lengths of the EMAs and the buffer size of the support and resistance zones to better fit the asset's volatility and your trading timeframe.

Volume Based S/R with EMA Crossover SignalsThis Pine Script indicator, titled "Volume Based S/R with EMA Crossover Signals," is designed for use on the TradingView platform and overlays on price charts to help traders identify potential buy and sell opportunities based on volume changes and EMA (Exponential Moving Average) crossovers. Let's break down its components for a detailed understanding:
Inputs
length: The number of bars used to calculate the standard deviation of the volume change. This parameter helps in identifying significant changes in volume over a specified period.
threshold: A multiplier applied to the standard deviation of volume change to determine significant spikes in volume, which are then used to identify support and resistance levels.
smoothLength: The length of the EMA used to smooth the price data, providing a clearer view of the overall price trend and helping to confirm trade signals.
fastEMALength and slowEMALength: The lengths of the fast and slow EMAs, respectively. These are used to generate crossover signals, where the crossing of the fast EMA over the slow EMA may indicate a potential entry or exit point.
Calculations
Volume Change and Standard Deviation: The script calculates the percentage change in volume from one bar to the next and then computes the standard deviation of these changes over the specified length. This process helps identify unusual volume activity, which can precede significant price movements.
Signal Generation Based on Volume: When the absolute value of the volume change divided by its standard deviation exceeds the threshold, it signals significant volume activity, potentially indicating strong support or resistance levels at previous highs or lows.
Smoothed Price: An EMA applied to the closing prices over smoothLength bars helps to confirm the trend direction and filter out noise.
EMA Crossover Signals: The script calculates two EMAs based on the fastEMALength and slowEMALength inputs. A crossover of these two averages generates potential buy or sell signals.
Logic for Buy/Sell Signals
Buy Signal: Generated when the price is above the identified support level (determined by significant volume activity), the fast EMA crosses above the slow EMA, and the price is also above the smoothed price. This confluence of conditions suggests upward momentum and potential buying opportunity.
Sell Signal: The opposite conditions generate a sell signal — when the price is below the identified resistance level, the fast EMA crosses below the slow EMA, and the price is below the smoothed price, indicating downward momentum and a potential selling opportunity.
Plotting
Support and Resistance Levels: Plotted as circles on the chart, with resistance levels in red and support levels in green, based on significant volume activity.
Smoothed Price and EMAs: The smoothed price line and both EMAs are plotted on the chart to help visually assess the trend and the crossover signals.
Buy and Sell Signals: Represented by shapes plotted on the chart, indicating the recommended trading action (buy or sell) based on the combined indicator logic.
Filling Between Support and Resistance: For visual clarity, the area between the identified support and resistance levels is filled, highlighting the range within which the price is expected to fluctuate.
This indicator offers a multi-faceted approach to trading, combining volume analysis with trend following via EMA crossovers. By identifying significant volume-based support and resistance levels and confirming trend direction with EMA crossovers and smoothed price trends, traders can make more informed decisions regarding entry and exit points. However, it's important to use this indicator as part of a comprehensive trading strategy, considering other factors such as market conditions, news, and technical analysis from other indicators.
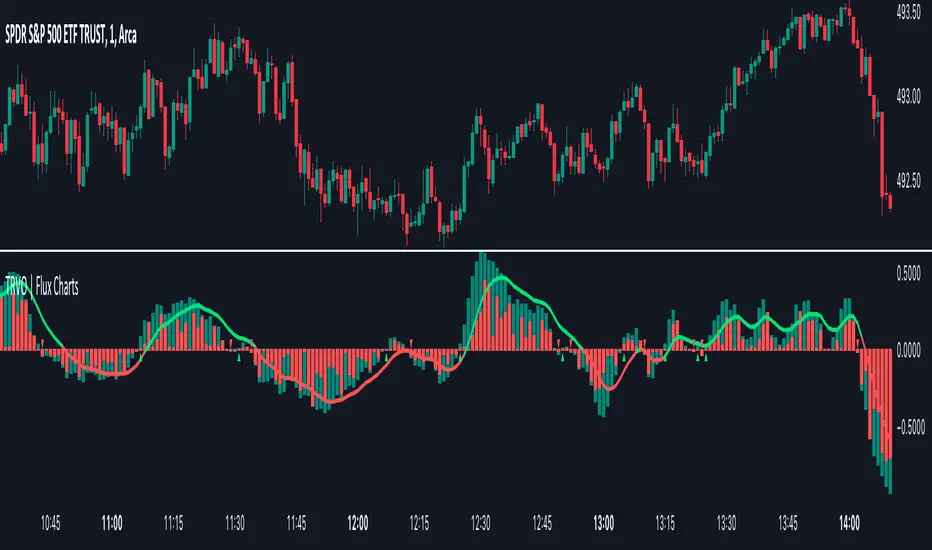
Time Relative Volume Oscillator | Flux Charts💎 GENERAL OVERVIEW
The relative volume indicator aims to improve upon the default existing relative volume indicator by comparing volumes between previous trading sessions rather than previous candles. As such, it works best on lower time frames as there is more data to compare with. The purpose of the indicator is to show how the current bar’s volume compares to the volume at the same time on previous trading days.
There exists a couple different modes and combinations that each provide a different perspective on the trading volume.
Oscillator mode
Oscillator mode starts with the same relative volume calculation, but adds two EMAs of different lengths that diverge and converge. Like the MACD, it plots the difference as a histogram. This functions as an easy way to view when relative volume is increasing or decreasing.
How to use:
The oscillator oscillates between -1 and 1. It moves along with volume direction, so this mode can be used to view the current volume direction in a lagging fashion. In oscillating markets, this indicator can give an idea of how buy/sell volume is moving and where it currently stands. Small arrows mark where reversals are predicted, when the histogram crosses over 0. The biggest pitfall of this mode is that, in a straight trending market, the two EMAs converge and it gives a false reversal signal.
Delta mode
Delta volume mode is a step up from the buy/sell volume mode. It separates both sides into the top and bottom, while also displaying the actual volume behind it in a semi transparent overlay. The best feature, however, is the delta oscillator. This oscillator fluctuates depending on how buy/sell volume is changing and plots bullish/bearish labels when the dominant side (bullish/bearish) changes. The signals, while a bit common, can sometimes dictate large direction changes, started by a dominant volume switch.
On top of different display modes, there is also one more volume mode: buy/sell volume. Instead of only showing the total volume and relative volume, it calculates and separates buying and selling volume.
This volume mode displays differently in all three viewing modes, but the basic principle is the same. It adds a vital piece of information to the chart without adding clutter. The calculation for buy/sell volume uses the candle wicks and body to compare bullish and bearish movement.
Classic mode
Classic mode takes the default volume indicator and improves upon it by also displaying the relative volume on top of the actual volume. Relative volume is calculated similarly between the three display modes: simply by comparing the current bar’s volume to the volume at the same time during previous trading days. Classic mode displays this “relative volume” as well as a simple EMA over top of the actual trading volume.
Originality
The script improves upon the existing relative volume indicator by using previous trading days rather than previous candles to generate the relative volume. On top of that, the calculation methods are unique, using different formulas like variations of the sigmoid function to smooth noise. The main issue this script aims to fix is that towards the start or end of the day relative volume indicators all see spikes as volume grows into close. The new relative volume calculations fix this problem and show what the “true” relative volume is because they compare the current bar to the “same” bar on previous trading sessions.
VWAP RangeThe VWAP Range indicator is a highly versatile and innovative tool designed with trading signals for trading the supply and demand within consolidation ranges.
What's a VWAP?
A VWAP (Volume Weighted Average Price) represents an equilibrium point in the market, balancing supply and demand over a specified period. Unlike simple moving averages, VWAP gives more weight to periods with higher volume. This is crucial because large volumes indicate significant trading activity, often by institutional traders, whose actions can reflect deeper market insights or create substantial market movements. The VWAP is also often used as a benchmark to evaluate the efficiency of executed trades. If a trader buys below the VWAP and sells above it, they are generally considered to have transacted favourably.
This is how it works:
Multiple VWAP Anchors:
This indicator uses multiple VWAPs anchored to different optional time periods, such as Daily, Weekly, Monthly, as well as to the highest high a lowest low within those periods. This multiplicity allows for a comprehensive view of the market’s average price based on volume and price, tailored to different trading styles and strategies.
Dynamic and Fixed Periods:
Traders can choose between using dynamic ranges, which reset at the start of each selected period, and specifying a date and time for a particular fixed range to trade. This flexibility is crucial for analyzing price movements within specific ranges or market phases.
Fixed ranges allow VWAPs to be calculated and anchored to a significant market event, the beginning of a consolidation phase or after a major news announcement.
Signal Generation:
The indicator generates buy and sell signals based on the relationship of the price to the VWAPs. It also allows for setting a maximum number of signals in one direction to avoid overtrading or pyramiding. Be sure to wait for the candle close before trading on the signals.
Average Buy/Sell Signal Lines:
Lines can be plotted to display the average buy and sell signal prices. The difference between the lines shows the average profit per trade when trading on the signals in that range. It's a good way to see how profitable a range is on average without backtesting the signals. The lines will also often turn into support and resistance areas, similar to value areas in a volume profile.
Customizable Settings:
Traders have control over various settings, such as the VWAP calculation method and bar color. There are also tooltips for every function.
Hidden Feature:
There's a subtle feature in this indicator: if you have 'Indicator values' turned on in TradingView, you'll see a Sell/Buy Ratio displayed only in the status line. This ratio indicates whether there are more sell signals than buy signals in a range, regardless of the Max Signals setting. A red value above 1 suggests that the market is trending upward, indicating you might want to hold your long positions a bit longer. Conversely, a green value below 1 implies a downward trend.

Supply Demand Profiles [LuxAlgo]The Supply Demand Profiles is a charting tool that measures the traded volume at all price levels on the market over a specified time period and highlights the relationship between the price of a given asset and the willingness of traders to either buy or sell it, in other words, highlights key concepts as significant supply & demand zones, the distribution of the traded volume, and market sentiment at specific price levels within a specified time period, allowing traders to reveal dominant and/or significant price levels and to analyze the trading activity of a particular user-selected range.
In other words, this tool highlights key concepts as significant supply & demand zones, the distribution of the traded volume, and market sentiment at specific price levels within a specified time period, allowing traders to reveal dominant and/or significant price levels and to analyze the trading activity of a particular user-selected range.
Besides having the tool as a combo tool, the uniqueness of this version of the tool compared to its early versions is its ability to benefit from different volume data sources and its ability to use a variety of different polarity methods, where polarity is a measure used to divide the total volume into either up volume (trades that moved the price up) or down volume (trades that moved the price down).
🔶 USAGE
Supply & demand zones are presented as horizontal zones across the selected range, hence adding the ability to visualize the price interaction with them
By default, the right side of the profile is the volume profile which highlights the distribution of the traded activity at different price levels, emphasizing the value area, the range of price levels in which the specified percentage of all volume was traded during the time period, and levels of significance, such as developing point of control line, value area high/low lines, and profile high/low labels
The left side of the profile is the sentiment profile which highlights the market sentiment at specific price levels
🔶 DETAILS
🔹 Volume data sources
The users have the option to select volume data sources as either 'volume' (regular volume) or 'volume delta', where volume represents all the recorded trades that occur at a given bar and volume delta is the difference between the buying and the selling volume, that is, the net demand at a given bar
🔹 Polarity methods
The users are able to choose the methods of how the tool to take into consideration the polarity of the bar (the direction of a bar, green (bullish) or red (bearish) bar) among a variety of different options, such as 'bar polarity', 'bar buying/selling pressure', 'intrabar (chart bars at a lower timeframe than the chart's) polarity', 'intrabar buying/selling pressure', and 'heikin ashi bar polarity'.
Finally, the interactive mode of the tool is activated, as such users can easily modify the intervals of their interest just by selecting the indicator and moving the points on the chart
🔶 SETTINGS
The script takes into account user-defined parameters and plots the profiles and zones
🔹 Calculation Settings
Volume Data Source and Polarity: This option is to set the desired volume data source and polarity method
Lower Timeframe Precision: This option is applicable in case any of the 'Intrabar (LTF)' options are selected, please check the tooltip for further details
Value Area Volume %: Specifies the percentage for the value area calculation
🔹 Presentation Settings
Supply & Demand Zones: Toggles the visibility of the supply & demand zones
Volume Profile: Toggles the visibility of the volume profile
Sentiment Profile: Toggles the visibility of the sentiment profile
🔹 Presentation, Others
Value Area High (VAH): Toggles the visibility of the VAH line and color customization option
Point of Control (POC): Toggles the visibility of the developing POC line and color customization option
Value Area Low (VAL): Toggles the visibility of the VAL line and color customization option
🔹 Supply & Demand, Others
Supply & Demand Threshold %: This option is used to set the threshold value to determine supply & demand zones
Supply/Demand Zones: Color customization option
🔹 Volume Profile, Others
Profile, Up/Down Volume: Color customization option
Value Area, Up/Down Volume: Color customization option
🔹 Sentiment Profile, Others
Sentiment, Bullish/Bearish: Color customization option
Value Area, Bullish/Bearish: Color customization option
🔹 Others
Number of Rows: Specify how many rows the profile will have
Placment: Specify where to display the profile
Profile Width %: Alters the width of the rows in the profile, relative to the profile range
Profile Price Levels: Toggles the visibility of the profile price levels
Profile Background, Color: Fills the background of the profile range
Value Area Background, Color: Fills the background of the value area range
Start Calculation/End Calculation: The tool is interactive, where the user may modify the range by selecting the indicator and moving the points on the chart or can set the start/end time using these options
🔶 RELATED SCRIPTS
Volume-Profile
Volume-Profile-Maps
Volume-Delta

SMA/EMA/RSImagic 36.963 by IgorPlahutaTwo Elements in this script:
Alerts: These are notifications that draw your attention to specific market conditions. There are two types:
RSI Higher Lows or Lower Highs: This alert triggers when the Relative Strength Index (RSI) forms higher lows or lower highs.
RSI Exiting 30 (Up) or RSI Exiting 70 (Down): These alerts activate when the RSI crosses the 30 threshold upwards or the 70 threshold downwards.
ALL BUY/SELL: to catch both of them with one setting
To Set Up an Alert: To configure an alert, select the one relevant to your trading strategy, choose the "Greater than" option, and input a value of "0" (this essentially activates the alert). Adjust other settings as per your requirements.
Please note that these alerts should be used in conjunction with a system you trust for confirmation.
Moving Averages: This involves monitoring several moving averages:
SMA12, SMA20, EMA12, EMA20: These moving averages are highlighted with background colors to help you quickly identify changes or crossovers. They are superimposed on each other for easy comparison.
SMA 50, SMA200: These moving averages are also highlighted with background colors to spot crossovers, and their lines change color depending on their direction (falling in red or rising in green).
Enjoy using these tools in your trading endeavors!

EMA Power BandsHello!
Today, I am delighted to introduce you to the "EMA Power Bands" indicator, designed to assist in identifying buying and selling points for assets moving in the markets.
Key Features of the Indicator:
EMA Bands: "EMA Power Bands" utilizes Exponential Moving Average (EMA) to create trend lines. These bands automatically expand or contract based on the price trend, adapting to market conditions.
ATR-Based Volatility: The indicator measures price volatility using the Average True Range (ATR) indicator, adjusting the width of the EMA bands accordingly. As a result, wider bands form during periods of increased volatility, while they narrow during lower volatility.
RSI-Based Buy-Sell Signals: "EMA Power Bands" uses the Relative Strength Index (RSI) to identify overbought and oversold zones. Entering the overbought zone generates a sell signal, while entering the oversold zone produces a buy signal.
Trend Direction Identification: The indicator assists in determining the price trend direction by analyzing the slope of the EMA bands. This allows you to identify periods of uptrends and downtrends.
Visualization of Buy-Sell Signals: "EMA Power Bands" visually marks the buy and sell signals:
- When RSI enters the overbought zone, it displays a sell signal (🪫).
- When RSI enters the oversold zone, it indicates a buy signal (🔋).
- When a candle closes above the emaup line, it displays a bearish signal (🔨).
- When a candle closes below the emadw line, it indicates a bullish signal (🚀).
By using the "EMA Power Bands" (EMA Güç Bantları) indicator, especially in trend-following strategies and periods of volatility, you can make more informed and disciplined trading decisions. However, I recommend using it in conjunction with other technical analysis tools and fundamental data.
*You can also use it with CCI as an example.
With this indicator, you can identify potential trend reversals in advance and strengthen your risk management strategies.
So, go ahead and try the "EMA Power Bands" (EMA Güç Bantları) indicator to enhance your technical analysis skills and make more informed trading decisions!

Volume Suite - By Leviathan (CVD, Volume Delta, Relative Volume)Volume Suite is an all-in-one script that includes several volume-based indicators such as CVD, Volume Delta, Relative Volume, Buy/Sell Volume, Cumulative Relative Volume and more. Additionally, it offers fully customisable appearance and features for improved data visualization, such as highlights for high volume activity, small price changes with high volume, or large price changes with low volume and more.
Data available in version 1:
- Volume Delta
Volume Delta is the net difference between Buy Volume and Sell Volume at a given bar. Positive Delta indicates that Buy Volume > Sell Volume, while Negative Delta means that Sell Volume > Buy Volume. As there is not way to get tick data on Tradingview, calculating Volume Delta is improvised by using the direction of lower timeframe candles and their volume.
- Cumulative Volume Delta (CVD)
CVD is a running total/cumulation of Volume Delta values, where positive VD gets added to the sum and negative VD gets subtracted from the sum. It can be used for trend strength analysis, divergence strategies, sentiment, etc.
- Buy/Sell Volume
Buy and Sell Volume provides an insight into volume activity in a given bar by estimating the buying/selling volume based on the direction of lower timeframe candles and their volume.
- Relative Volume
Relative Volume is used to compare current trading volume to past trading volume over a given period. For instance, a relative volume of 1.0 indicates that volume is at an average level, while a relative volume of 2.0 suggests that the volume is twice as high as the average.
- Cumulative Relative Volume (CRVOL)
CRVOL is a running total/cumulation of Relative Volume values, where RVOL at close>open gets added to the sum and RVOL at close
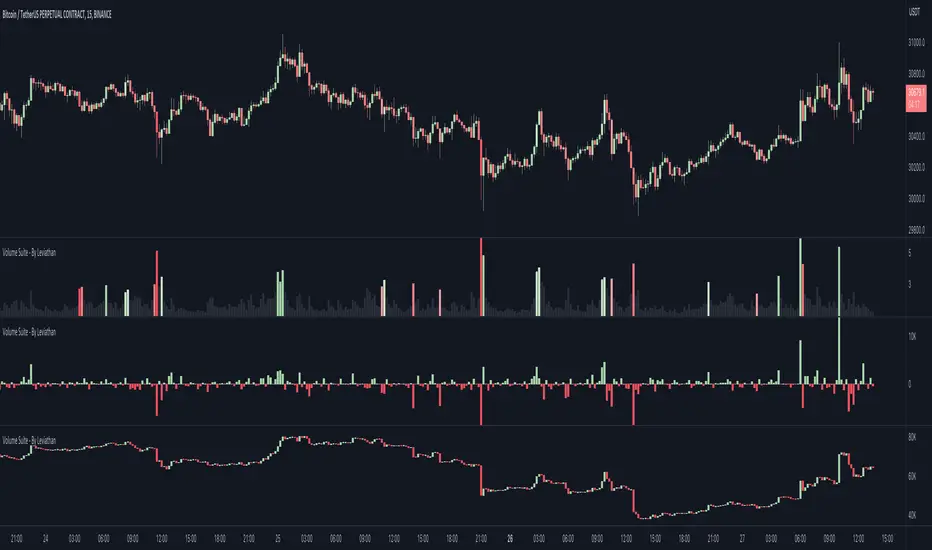
RDX Relative Directional IndexRDX Relative Directional Index, Strength + Direction + Trend. This indicator is the combination of RSI and DMI or ADX. RDX aims at providing Relative direction of the price along with strength of the trend. This acts as both RSI and Average Directional Index. as the strength grows the RSI line becomes wider and when there is high volatility and market fluctuation the line becomes thinner. Color decides the Direction. This indicator provides sideways detection of RSI signal.
RDX Width: This determines the strength of RSI and Strength of ADX, The strength grows RDX band grows wider, as strength decreases band shrinks and merge into the RSI line. for exact working simply disable RSI plot on the indicator. when there is no strength the RSI vanishes..
Technical:
RSI : with default 14 period
ADX : Default 14 period
RDX=RSI+(ADX-20)/5
Color Code:
Red: Down Direction
Green: Up Direction
Sideways:
A rectangular channel is plotted on RSI 50 Level
Oversold Overbought:
Oversold and Overbought Levels are plotted for normal RSI Oversold and Overbought detection.
Buy/Sell:
Buy sell signals from ADX crossover are plotted and its easy to determine
Strength + Direction + Trend in one go
Hope the community likes this...
Contibute for more ideas and indicators..
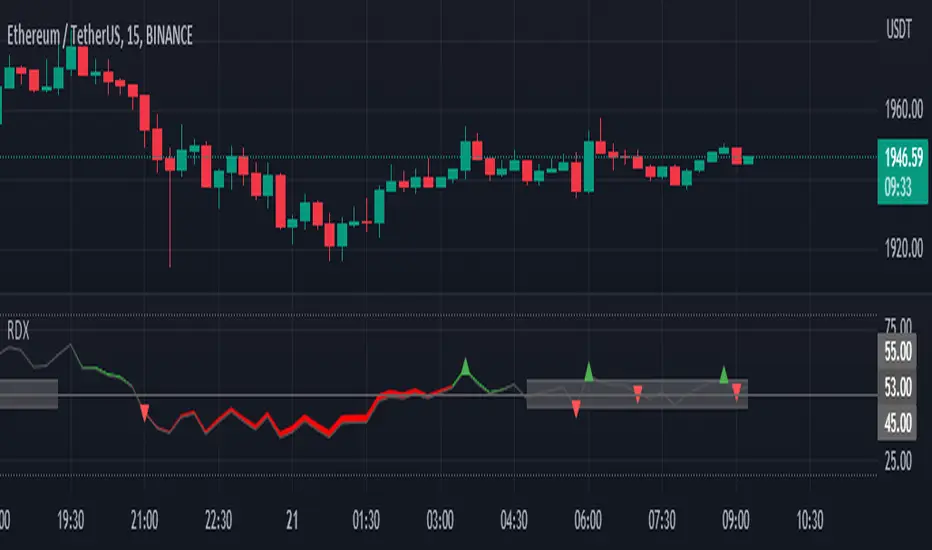
RiverFlow ADX ScreenerRiverFlow ADX Screener, Scans ADX and Donchian Trend values across various Timeframes. This screener provides support to the Riverflow indicator. Riverflow concept is based on Two indicators. Donchian Channel and ADX or DMI.
How to implement?
1.Donchian Channel with period 20
2. ADX / DMI 14,14 threshold 20
Entry / Exit:
1. Buy/Sell Signal from ADX Crossovers.
2. Trend Confirmation Donchian Channel.
3. Major Trend EMA 200
Buy/Sell:
After a buy/sell is generated by ADX Crossover, Check for Donchian Trend. it has to be in same direction as trend. for FTT trades take 2x limit. for Forex and Stocks take 1:1.5, SL must be placed below recent swing. One can use Riverflow indicator for better results.
ADX Indicator is plotted with
Plus: Green line
Minus: Red Line
ADX strength: plotted as Background area.
TREND: Trend is represented by Green and Red Area around Threshold line
Table:
red indicates down trend
green indicates up trend
grey indicates sideways
Weak ADX levels are treated sideways and a channel is plotted on ADX and PLUS and MINUS lines . NO TRADES are to be TAKEN on within the SIDEWAYS region.
Settings are not required as it purely works on Default settings. However Donchian Length can be changed from settings.
Timeframes below 1Day are screened. Riverflow strategy works on timeframe 5M and above timeframe. so option is not provided for lower timeframes.
Best suits for INTRADAY and LONG TERM Trading

True Trend Average BandsThis is the indicator I am most proud of. After reading Glenn Neely's book "Mastering Eliott Waves" / "Neowave" and chatting with @timwest who got acknowledged by Neely, we came up with the idea of an moving average which does calculate the real average price since a trend started. Addionally I adapted a method from Neely Neowave and Tim Wests TimeAtMode to not force a timeframe on a chart but instead let the charts data decide which timeframe to use, to then calculate the real average price since the trend started.
It took me a while to get this right and coded, so take a moment and dive deeper and you might learn something new.
We assume that the price is in multiple trends on multiple timeframes, this is caused by short term traders, long term traders and investors who trade on different timeframes. To find out in which timeframe the important trends are, we have to look out for significant lows and highs. Then we change the timeframe in the chart to a value so that we have 10 to 20 bars since the significant low/high. While new bars are printed, and we reach more than 20 bars, we have to switch to a higher timeframe so we have 10 to 20 bars again. In the chart you see two significant trends: a downtrend on the 3 week timeframe and an uptrend from the 2 month timeframe. Based on the logic I have described, these are the two important timeframes to watch right now for the spx (there is another uptrend in the yearly chart, which is not shown here).
Now that we understand how to find the important timeframes, let's look what the magic in this script is that tells us the real average price since a trend started.
I developed a new type of moving average, which includes only the prices since a trend started. The difference to the regular sma is that it will not include prices which happened before the significant low or high happened. For example, if a top happened in a market 10 days ago, the regular sma20 would be calculated by 10 bars which happened before the top and 10 bars which happened after the top. If we want to know the average price of the last 10 bars we manually have to change the ma20 to the ma10 which is annoying manual work, additionally even if we use the ma10 in this case, and we look at yesterday's bar the ma10 will include 9 bars from after the top and one bar before the top, so the ma10 would only show the real average price for the current bar which is not what we want.
To come up with a solution to this problem, the True Trend Average searches for the lowest/highest bar in a given period (20 bars). Then starts to calculate the average value since the low/high. For example: if the price reaches a new 20 day high and then trades below it, the day of the high will be the sma1, the day after it's the sma2, ... up to the maximum look back length.
This way, we always know what the average price would have been if someone sold/bought a little bit every bar of his investment since the high/low.
Why is this even important? Let's assume we missed selling the top or buying the low, and think it would have been at least better to buy/sell a little bit since the new trend started. Once the price reaches the true trend average again, we can buy/sell, and it would be as good as selling/buying a little bit every day. We find prices to buy the dip and sell the bounce, which are as good as scaling in/out.
There is a lot more we can learn from these price levels but I think it is better to let you figure out yourself what you can learn from the information given by this indicator. Think about how market participants who accumulate or distribute feel when prices are above or below certain levels.
Now that we understand this new type of moving average, let's look into the lines we see in the chart:
The upper red band line shows the true trend average high price since the last significant top within 20 bars.
The lower red band line shows the true trend average hl2 price since the last significant top within 20 bars.
The lower green band line shows the true trend average low price since the last significant low within 20 bars.
The upper green band line shows the true trend average hl2 price since the last significant low within 20 bars.
The centerline is the average between the upper red band and the lower green band.
The teal lines show 1 standard deviation from the outer bands.
Before today only a few people had access to this indicator, now that it is public and open source, I am curious if you will find it useful and what you will do with it. Please share your findings.
/edit: The chart only shows the 3week timeframe so here are the other two trends from the 2month and 1year timeframe
